Triangle de penrose — Le triangle de Penrose, aussi connu comme la tripoutre ou le tribarre, est un objet impossible conçu par le mathématicien Roger Penrose dans les années 1950. C est une figure importante dans les travaux de l artiste Maurits Cornelis Escher. Cette … Wikipédia en Français
Triangle impossible — Triangle de Penrose Le triangle de Penrose, aussi connu comme la tripoutre ou le tribarre, est un objet impossible conçu par le mathématicien Roger Penrose dans les années 1950. C est une figure importante dans les travaux de l artiste Maurits… … Wikipédia en Français
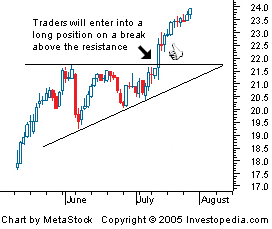
Triangle — A technical analysis pattern created by drawing trendlines along a price range that gets narrower over time because of lower tops and higher bottoms. Variations of a triangle include ascending and descending triangles. Triangles are very similar… … Investment dictionary
Descending Triangle — A bearish chart pattern used in technical analysis that is created by drawing one trendline that connects a series of lower highs and a second trendline that has historically proven to be a strong level of support. Traders watch for a move below… … Investment dictionary
Submandibular triangle — Submandibular triangle … Wikipedia
Carotid triangle — Infobox Anatomy Name = PAGENAME Latin = trigonum caroticum GraySubject = 145 GrayPage = 564 Caption = The triangles of the neck. (Anterior triangles to the left; posterior triangles to the right. Superior carotid triangle labeled at center left.) … Wikipedia
Fibonacci Extensions — Levels used in Fibonacci retracement to forecast areas of support or resistance. Extensions consist of all levels drawn beyond the standard 100% level and are used by many traders to determine areas where they will wish to take profits. The most… … Investment dictionary
Triangles de Penrose — Triangle de Penrose Le triangle de Penrose, aussi connu comme la tripoutre ou le tribarre, est un objet impossible conçu par le mathématicien Roger Penrose dans les années 1950. C est une figure importante dans les travaux de l artiste Maurits… … Wikipédia en Français
Tribar — Triangle de Penrose Le triangle de Penrose, aussi connu comme la tripoutre ou le tribarre, est un objet impossible conçu par le mathématicien Roger Penrose dans les années 1950. C est une figure importante dans les travaux de l artiste Maurits… … Wikipédia en Français
Tripoutre — Triangle de Penrose Le triangle de Penrose, aussi connu comme la tripoutre ou le tribarre, est un objet impossible conçu par le mathématicien Roger Penrose dans les années 1950. C est une figure importante dans les travaux de l artiste Maurits… … Wikipédia en Français

